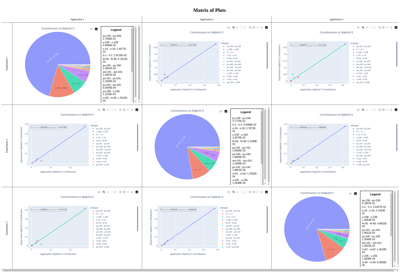
Matrix Plots
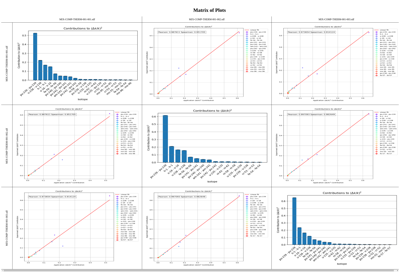
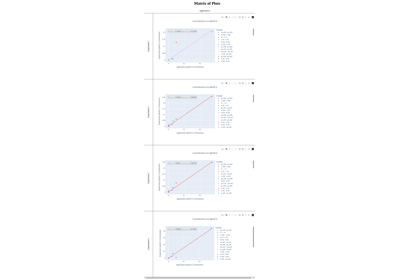
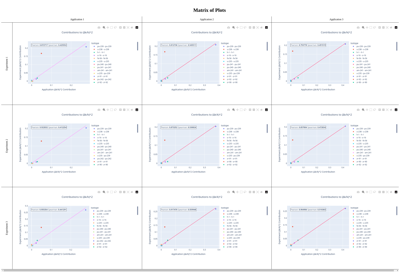
These examples demonstrate the use of the tsunami_ip_utils.viz.viz.matrix_plot() function to generate a matrix of plots.
This is useful for comparing multiple applications and experiments in a single figure.
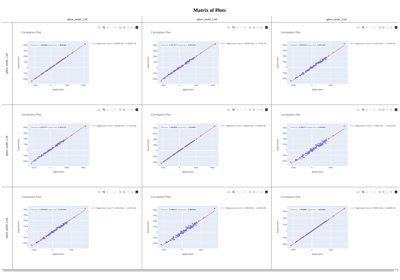
Matrices With a Different Set of Applications and Experiments
Matrices With a Different Set of Applications and Experiments